

As of August 2026, an Indian insurance agent should track about 15 KPIs every month in four groups: activity (conversations, meetings, fact-finds), conversion ratios (lead-to-meeting, meeting-to-proposal, proposal-to-issuance), production (new business premium, first-year commission, ticket size, product mix) and retention (13th to 61st month persistency, renewals, lapses, claim support). Review activity weekly and results monthly.
Most agents look at one number: commission credited this month. That is a result, not a diagnosis. The KPIs below explain why the number moved and what to change next month. Every worked example in this guide is illustrative, using hypothetical numbers, unless a source is linked.
Retention deserves as much attention as new sales. According to the IRDAI Annual Report 2024-25, life insurers collected ₹4.88 lakh crore of renewal premium in 2024-25 against ₹3.98 lakh crore of new business premium, so renewals made up 55.09% of total premium. Benefits paid on surrenders and withdrawals rose 1.77% to ₹2.33 lakh crore.
What is the difference between leading and lagging KPIs?
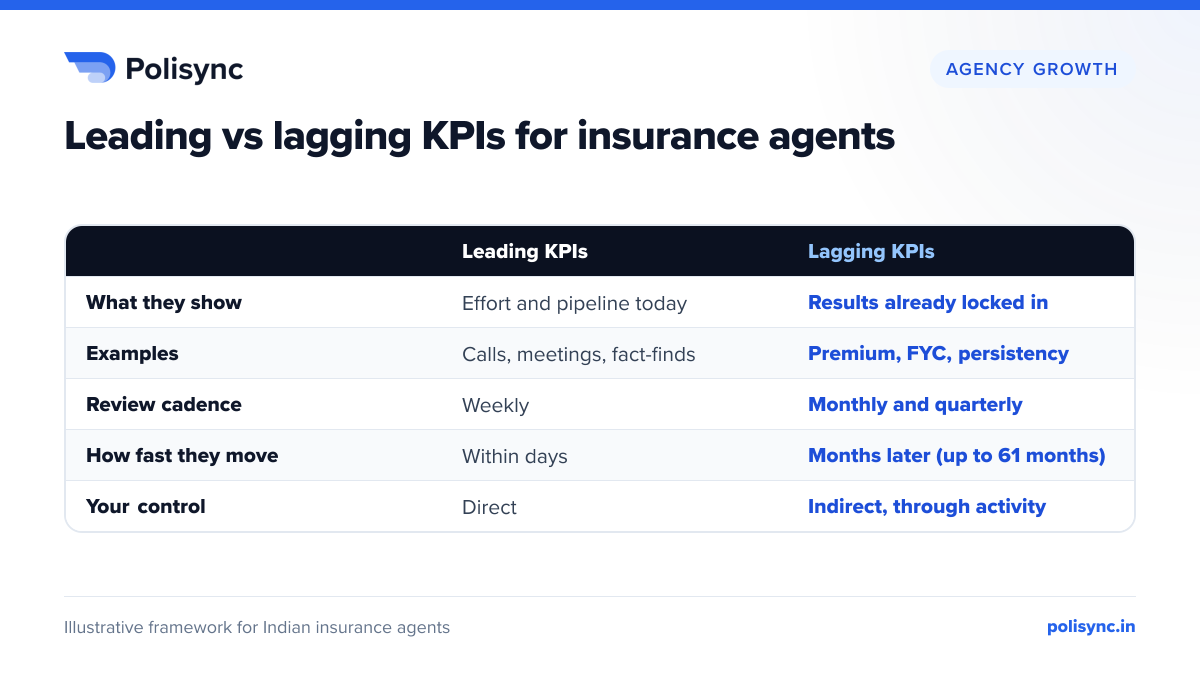
A leading indicator is a number that predicts future results, such as meetings booked this week. A lagging indicator records results that have already happened, such as premium issued or 13th month persistency. You control leading indicators directly; lagging indicators only move when the leading ones do.
Lagging KPIs decide your income, MDRT status and standing with the insurer, but they arrive late. Persistency tells you in month 13 whether a sale made a year earlier was the right sale. Leading KPIs give you time to correct course within the same month.
Which activity KPIs should agents track every week?
Activity KPIs are plain counts of the work that creates business. Keep the definitions strict and count honestly, every week.
- Genuine conversations: calls, WhatsApp chats and walk-ins where you actually spoke with a prospect about their needs. Unanswered dials do not count.
- Meetings held: first meetings completed in person or on video. Booked but cancelled meetings do not count.
- Fact-finds completed: meetings where you recorded income, dependants, existing cover, loans and goals in writing. A fact-find is the structured needs-discovery conversation that every suitable recommendation should rest on.
- Review meetings with existing clients: annual reviews and renewal conversations, which feed referrals, cross-sell and persistency.
Illustrative example: an agent who wants 10 new meetings a week and books one meeting for every 5 genuine conversations needs about 50 conversations a week, or 10 per working day. Your own ratio, not a generic rule, sets this number, which is why conversion KPIs matter.
How do you calculate sales funnel conversion ratios?
Conversion ratios show where prospects drop out. Each ratio is one stage divided by the stage before it, multiplied by 100.
- Lead-to-meeting ratio = meetings held ÷ new leads × 100
- Meeting-to-proposal ratio = proposals submitted ÷ meetings held × 100
- Proposal-to-issuance ratio = policies issued ÷ proposals submitted × 100
- Overall lead-to-policy rate = policies issued ÷ new leads × 100
In the illustrative funnel below, 100 leads produce 40 meetings (a 40% lead-to-meeting ratio), 30 fact-finds, 15 proposals (37.5% of meetings) and 10 issued policies (about 67% of proposals). The overall lead-to-policy rate is 10%.
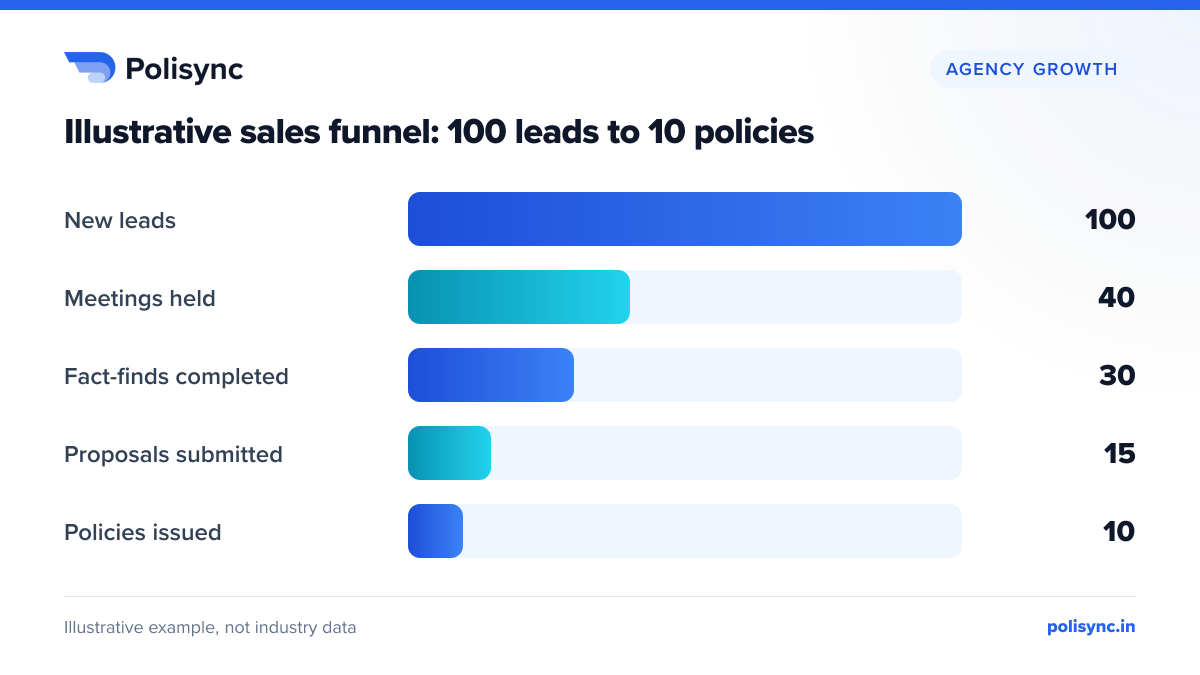
Read the funnel from the bottom up. A weak proposal-to-issuance ratio usually points to medical, underwriting or documentation drop-offs rather than selling skill. A weak lead-to-meeting ratio points to lead quality or slow follow-up; our insurance lead management guide covers how to capture, qualify and follow up leads.
How to set activity targets by working backwards
Illustrative example: your monthly first-year commission goal is ₹63,000 and your average FYC per issued case is ₹6,300, so you need 10 policies. At a 67% proposal-to-issuance ratio that means 15 proposals; at 37.5% meeting-to-proposal, 40 meetings; at 40% lead-to-meeting, 100 leads. Over a four-week month, that is about 25 new leads and 10 meetings a week.
How do you track new business premium, FYC, ticket size and product mix?
These are your core production KPIs, and the ones insurers and MDRT measure you on. Count only issued policies, not cases logged.
- New business premium = total first-year premium of policies issued in the month.
- First-year commission (FYC) = commission earned on the first year's premium of those new policies. Track renewal commission separately.
- Average ticket size = new business premium ÷ number of policies issued. Insurers report a similar figure: Aviva Life's Form L-22 disclosure shows an average individual non-single premium ticket size of ₹73,675 for April to December 2025.
- Product mix = premium from each product type ÷ total new business premium × 100, for example protection (term, health, critical illness) versus savings (endowment, ULIP, annuity).
Illustrative example: 10 policies issued with total first-year premium of ₹4,20,000 give an average ticket size of ₹42,000. If ₹1,26,000 of that premium came from term and health plans, protection is 30% of the mix. If the blended FYC on these cases is ₹63,000, that is your production number for the month.
Track FYC per case alongside ticket size, because commission rates differ by product and premium paying term. The insurance commission calculator and our commission tracking guide show how to reconcile what you expected against what the insurer credited.
Product mix is also a suitability check. A book dominated by one product type can signal that clients are being fitted to a product rather than a need, and that tends to surface later as poor persistency.
What is persistency and how is it calculated?
Persistency is the share of regular or limited-premium policies, or of their premium, still being paid at a set point after issue. Life insurers publish it at the 13th, 25th, 37th, 49th and 61st month in their quarterly Form L-22 public disclosures, on two bases: number of policies and premium, as Aviva Life's disclosure for the quarter ended 31 December 2025 shows.
Simple formulas for your own book:
- 13th month persistency (policy basis) = policies that paid the second-year premium ÷ policies due for it × 100
- 13th month persistency (premium basis) = renewal premium received ÷ renewal premium due for that group of policies × 100
- 25th, 37th, 49th and 61st month ratios apply the same test at the start of years 3, 4, 5 and 6.
Insurers calculate the official figures using regulatory disclosure formats, so treat your insurer's report as the official number and your own tracker as an early warning.
Industry data shows how steeply persistency falls. In Cafemutual's analysis of FY26 data, published on 16 June 2026, 13th month premium persistency ranged from 54.4% at the weakest life insurer to above 85% at the leaders, while 61st month premium persistency fell as low as 25.58% and no insurer was above 72%. LIC stood at 70.9% at the 13th month and 58.31% at the 61st month on a premium basis, and 58.41% and 47.26% on a policy basis.
Single insurers show the same decay. Aviva Life's Form L-22 for April to December 2025 reports 75% at the 13th month and 43% at the 61st month on a premium basis, and 69% and 39% on a policy-count basis.
Illustrative example for your own book: 40 regular-premium policies you issued a year ago fall due for their second annual premium. If 34 pay, your 13th month persistency is 85% on a policy basis. If ₹12,60,000 of the ₹14,00,000 due is collected, it is 90% on a premium basis. A lower policy ratio than premium ratio means smaller policies are lapsing first.
For practical ways to lift these numbers, see our guide on how to reduce policy lapse rates.
How do you measure renewals, lapses and claim support?
- Renewal rate (health, motor and other annual policies) = policies renewed ÷ policies due for renewal in the month × 100.
- Lapse rate (life) = policies that lapsed after the grace period ÷ policies with premium due × 100. Under IRDAI's Master Circular on Protection of Policyholders' Interests, 2024 dated 5 September 2024, the grace period is 15 days for monthly premiums and 30 days for quarterly, half-yearly and annual premiums.
- Claim-support turnaround = average working days from a client telling you about a claim to you submitting a complete set of documents to the insurer.
Illustrative example: 52 health and motor policies were due for renewal this month and 46 renewed, an 88.5% renewal rate. Of 60 life policies with premium due, 3 lapsed after the grace period, a 5% lapse rate.
Claim support is where clients judge you. The same master circular requires insurers to settle death claims within 15 days of intimation where no investigation is needed (45 days where it is), decide cashless health requests within one hour and grant final discharge authorisation within three hours. Your own paperwork should never be the bottleneck, so log every claim the day it is reported and set a turnaround target, for example two working days.
How do you track referrals, cost per lead and MDRT progress?
- Referrals received = new named introductions per month. Also track referrals per issued policy; illustratively, 6 referrals from 10 new clients is 0.6 per policy.
- Cost per lead = total marketing spend ÷ leads generated. Illustratively, ₹15,000 spent on ads, events and printing for 100 leads is ₹150 per lead; with 10 issued policies, cost per policy is ₹1,500.
- MDRT progress = year-to-date qualifying production ÷ annual MDRT target × 100, compared with the share of the year already gone.
For reference, MDRT's 2026 membership requirements (global edition dated 15 December 2025, based on 2025 production) set India's entry thresholds at ₹11,32,600 of eligible commission, ₹45,30,400 of eligible premium or ₹19,61,600 under the income method. You qualify under one method only, and business counts only if it is paid for between 1 January and 31 December and is still in force on 31 December.
The same document requires at least 50% of the commission or premium requirement, that is ₹5,66,300 of commission or ₹22,65,200 of premium, to come from risk-protection products such as individual life, critical illness and disability cover. Health insurance sits under "other products", so track protection production as its own line. MDRT resets its thresholds every year, so confirm the figures for your qualifying year on its website.
Illustrative pace check: the ₹11,32,600 commission threshold works out to roughly ₹94,400 a month, so by the end of July you would want about ₹6.6 lakh of qualifying commission, at least half of it from risk-protection products. The MDRT calculator and our guide on how to qualify for MDRT in India walk through the maths.
What should a simple insurance agent KPI dashboard look like?
One page, four blocks, refreshed on a fixed day. If a KPI never leads to a decision, drop it.
- Block 1, Activity (weekly): genuine conversations, meetings held, fact-finds and review meetings, each against target.
- Block 2, Funnel (monthly): lead-to-meeting, meeting-to-proposal, proposal-to-issuance and overall lead-to-policy rate, with last month alongside.
- Block 3, Production (monthly): policies issued, new business premium, FYC, average ticket size, protection share of the mix and MDRT pace.
- Block 4, Retention and service (monthly): 13th and 25th month persistency for your own cohorts, renewal rate, lapses, open claims and their age, referrals received and cost per lead.
A spreadsheet is enough to start. As the book grows, agency management software can keep policy, renewal and commission records organised in one place, which makes these numbers quicker to pull; Polisync is one option.
If you manage sub-agents, keep the same dashboard for each person and compare ratios, not just premium. Our guide on how to grow an insurance agency covers how to scale a team without losing sight of quality.
What does a weekly and monthly KPI review routine look like?
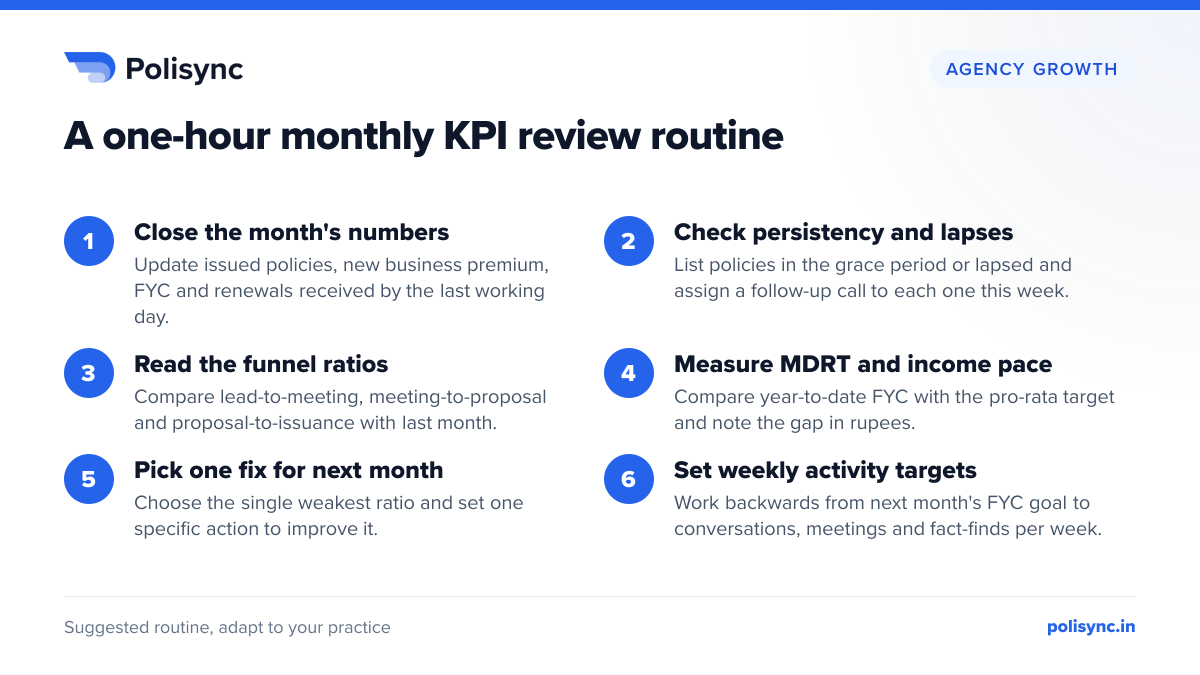
Keep a fixed ritual: 15 minutes every Monday for activity, and one hour in the first week of each month for results. The weekly check asks two questions: did you hit last week's conversation, meeting and fact-find targets, and what is already booked for this week?
The monthly review goes deeper and follows the same order every time, so comparisons stay honest.
What this means for insurance agents: a KPI action checklist
Tracking is not about more reporting; it is about spotting problems early enough to fix them in the same month. Start small and stay consistent.
A practical checklist to set up this month:
- 1. Write your 12 to 15 KPIs on one page, grouped into activity, funnel, production and retention.
- 2. Pull the last three months of data from your records and insurer statements to set a baseline for each KPI.
- 3. Calculate your own conversion ratios, then work backwards from your monthly FYC goal to weekly conversations and meetings.
- 4. Tag every policy with its product type so product mix and protection share calculate themselves.
- 5. Build a persistency list of every policy approaching its 13th, 25th and 37th month premium, and contact each client before the due date.
- 6. Log every claim the day it is reported and measure your document turnaround.
- 7. Record the source and cost of every lead so cost per lead and cost per policy are real numbers, not guesses.
- 8. Block 15 minutes every Monday and one hour in the first week of each month for reviews, and change one thing each month.